Research
Elastographic imaging
Ultrasound elastography are techniques to estimate the biological tissue mechanical properties by measuring local tissue deformations (strain) when subjected to a (known) force or by inducing a shearwave in the tissue (SWI). In strain imaging, tissue that undergoes large deformation/high strain can be considered soft (Figure) compared to hard tissue that shows low strain. In SWI, the propagation speed of the shear wave is directly related to Young's modulus of the tissue.
Strain Imaging
Ultrasound strain imaging aims at providing an objective variant of palpation. Palpation is what physicians perform when they use their tactile senses to detect irregular structures and changes in stiffness in tissue by pressing on them. Those irregularities and changes are often strong indicators for diseases. Since palpation is limited by the accessibility of the organs, it is not quantitative but is strongly dependent on the expertise of the performing clinician. With ultrasound strain imaging also, noninvasive deformation measurements of more deeply located structures can be performed and visualized in so-called elastograms (or strain maps).
 Figure 1: Principle of ultrasoudn strain imaging
Ultrasound strain imaging was first described by Ophir and his co-workers. For this technique, ultrasound data are acquired in a pre-deformation (relaxed) state and compared with ultrasound data acquired in a post-deformation state (activated). To create the (small) deformation, a force is required which can be applied externally or internally. Internal body forces can originate from respiratory motion, the beating of the heart, or variations in blood pressure as for example in carotid strain imaging. If the rate of deformation relative to the ultrasound acquisition frame rate is low, the method is also often referred to as quasi-static strain imaging. Negative strain indicates compressive deformation (i.e. squashing) while positive strain indicates tensile strain (i.e. stretching). Therefore, normal strain (ε), also known as engineering strain, is defined as the ratio of the change in length of a tissue, ΔL, divided by the original length of the tissue, L.
Shear Wave Imaging
With the advent of ultrafast ultrasound, a new way of ultrasound imaging that enables image acquisition at 100-fold faster imaging rates than conventional ultrasound, fast anatomical imaging and new possibilities for functional imaging of tissue have become available. One of these new imaging modes is shear wave elastography (SWE), which allows mapping the elasticity of tissue within 1/10 of a second. This technique is currently mainly clinically applied to quantify liver stiffness for staging liver disease and to identify and classify lesions in breast.
Figure 2 schematically shows the basic principles of the technique. SWE uses one or multiple focussed ultrasound transmissions to create sufficient acoustic radiation force to locally displace the tissue. This local offset of the tissue and the tissue relaxation after release of the force results in (a) shear wave(s) propagating perpendicular to the ultrasound beam, causing transient displacements in the tissue as the wave propagates. The propagation speed of the shear wave can be estimated by measuring the arrival time of a certain characteristic of these transient displacements (f.i. the peak displacement) at multiple positions, using ultrafast ultrasound imaging in combination with speckle tracking or Doppler-based motion estimation. This speed is directly related to the shear modulus µ of the tissue, an absolute measure of the tissue’s elasticity.
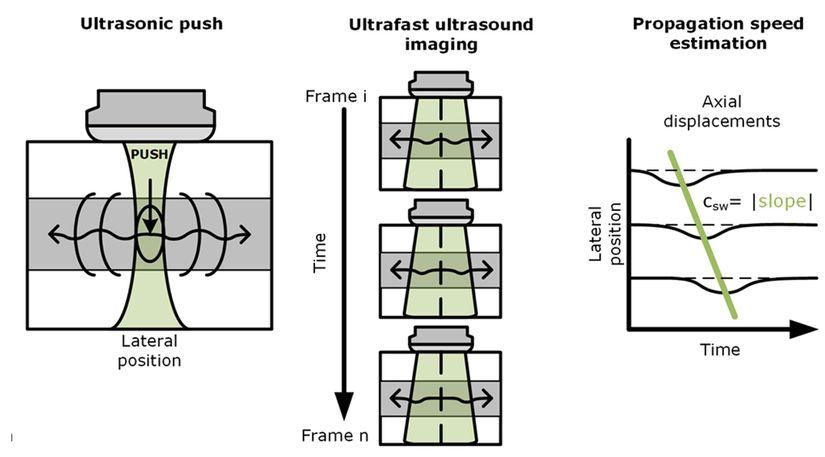
Figure 2: Schematic illustration of the basics of ultrasound shear wave elastography. A short focussed ultrasound pulse is transmitted into the tissue which ‘pushes’ the tissue at the focal spot and leads to the generation of (a) shear wave(s) travelling perpendicular to the push direction. b) the transient tissue displacement can be monitored at multiple positions using ultrafast ultrasound imaging in combination with motion estimation algorithms. c) from the arrival time of a certain characteristic of the transient displacement curves at multiple positions along the wave propagation path, the speed of the wave can be determined. This shear wave speed is directly related to tissue stiffness
For homogeneous, isotropic, linearly elastic tissue much thicker than the shear wave’s wavelength, a simple relation can be used to convert shear wave velocity (csw) to elastic shear modulus:
µ = ρcsw2,
where ρ is the density, which is typically around 1000 kg/m3 for soft biological tissues.
For incompressible tissue a simple relation exists between the shear modulus, which is the ratio of shear stress/shear strain, and the Young’s modulus, E, which defines how much a tissue will stretch or shorten when being pulled or pushed (stress loading) in that direction:
E = 3µ = 3 ρcsw2.
These assumptions and the corresponding relations are what most commercial ultrasound system use in shear wave elastography mode to produce an elastogram, i.e. a color-coded map of the Young’s modulus as a function of position and depth. To obtain Young’s modulus values for multiple tissue locations, the approach described in figure 1 is repeated by pushing at multiple positions.
Figure 3 shows examples of shear wave velocity maps and the corresponding elastograms for an elastography phantom obtained using a commercial Supersonic Imagine Aixplorer ultrasound system.
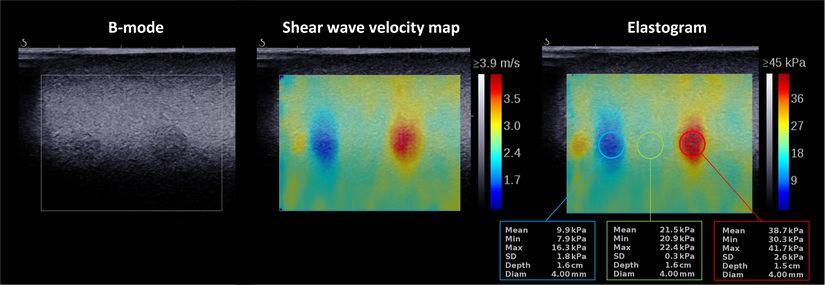
Figure 3: B-mode, shear wave velocity map, and corresponding Young’s modulus map/elastogram for a CIRS phantom (Model 040GSE) highlighting the possibility to detect soft and stiff lesions in a moderately stiff background and to quantify their stiffness. The images were acquired using a Supersonic Imagine Ultimate Aixplorer system equipped with an SL10-2 linear array transducer.
Research/developments
Displacement compounding
Ultrasound displacement and strain imaging can be very accurate in the direction of the ultrasound beam due to the availability of phase information. Hence the displacement and strain imaging accuracy perpendicular to beam direction is less due to the absence of phase. A method that circumvents the lack of phase information in lateral direction is called angular compounding or displacement compounding. In this technique, ultrasound beam steering is used to obtain multiple axial displacement estimates, which are projected in the lateral direction, as depicted in Figure 1.5. In this way, lateral displacement estimates benefit from the availability of phase information and become more accurate. In theory, larger beam steering angles provide more accurate lateral displacements because the steered beam becomes more aligned with the lateral direction. However, in practice, this is often not feasible because the ultrasound quality reduces due to a decrease in element sensitivity and pronounced grating lobe interference. Furthermore, geometrically the field of view size and depth are determined by the overlapping area of the steered beams, which depends on the width of the aperture width of the transducer. Figure 4 displays the displacement compounding scheme for two steered displacements (d_α^ax,d_(-α)^ax ) estimated using both pre- and post-deformation states and projected into the lateral/horizontal direction (d_0^(Comp_lat )) according to equation 1.3.
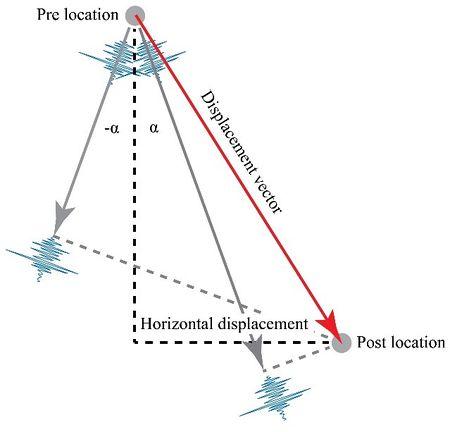
Figure 4 Principle of displacment compounding to obtain an rf-based estimate of the displacement perpendicular to the ultrasound beam propagation
High performance beamforming grid
Using ultrafast image acquisition and plane wave imaging, grants the freedom to convert unfocused element data into focused RF data at any given location within the region insonified. Displacement compounding combines axial displacement estimates of at least two acquisition angles; hence, ideally, the underlying sampling grids for RF data of the multiple angles should coincide at points where a compound displacement estimate is to be estimated. Rotating the zero-degree beamforming grid to an arbitrary angle does not provide these coinciding points. Within our lab we designed a novel way to combine the zero-degree grid with the angular grids yielding the displacement grid defined by spatially overlapping specific sample locations of all grids. It turns out that it is only possible to create such a grid combination with orthogonality as a prerequisite, for certain transmit angles α.
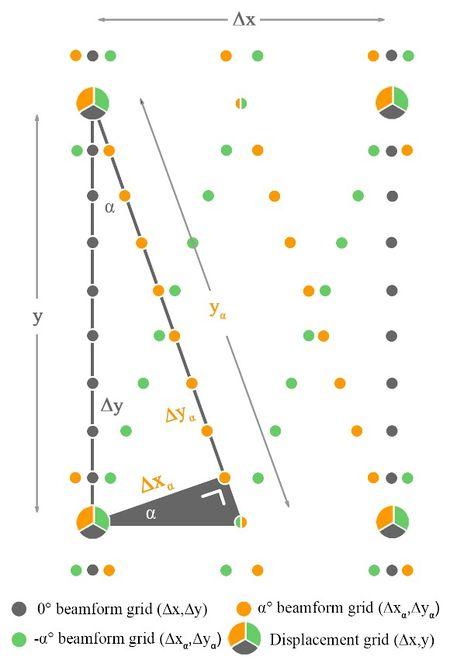
Figure 5: Smart beam-forming grid facilitating displacement compounding
Patient specific phantom of the carotid bifurcation
In order to perform feasibility tests of multiple ultrasound-based techniques like strain imaging and bloodflow imaging, our lab designed a tissue mimicking phantom of the carotid bifurcation. This phantom is based on a patient specific geometry and made of PVA-cryogel matching the acoustic and mechanical properties of real tissue. The vessel wall was surrounded by a second body PVA gel supporting the vessel-wall strength. The phantom was connected to a pulsatile circulation of blood mimicking fluid matching real physiological blood flow and pressure characteristics.
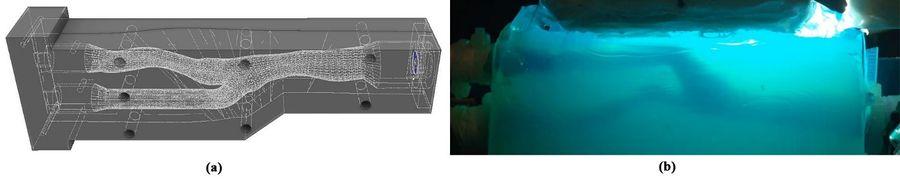
Figure 5: A realsitic bifurcation phantom (pael b) was created using a 3D printed mold (panel a).
Towards 3D strain imaging: Multi-slice in vivo gated ultrasound acquisitions
One of the main limitations of 2D strain imaging is the accuracy degradation of the strain map due to out of plane motion. Therefore, our lab developed an acquisition setup to combine multiple 2D images and process them into a dynamic 3D ultrasound volume of the carotid artery bifurcation. In this way we were able to calculate the carotid artery wall motion in 3D. This information was them finally processed into a 3D strain map allowing the assessment of the carotid wall mechanics. This information might hold the potential to classify the risk for plaque rupture better than the relative amount of vessel occlusion by the plaque which is mainly used today.
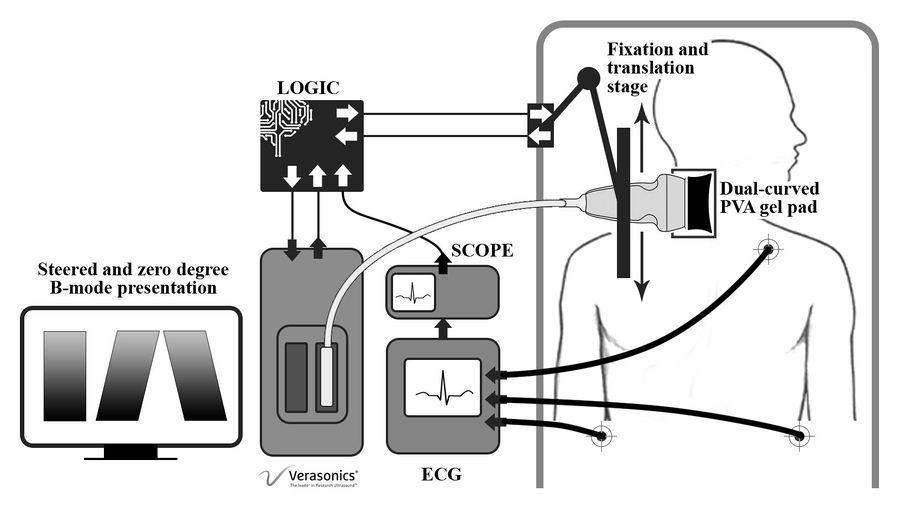
Figure 6: Schematic representation of carotid 3D strain imaging setup.
Guided wave analysis in transverse vessel cross-sections
For tissue structures with a thickness similar to or thinner than the wavelength of the induced waves, the waves are no longer perfect shear waves and become guided by the geometry of tissue boundaries. This is, for instance, the case in arteries where the wall thickness is in the order of 1 mm. A systematic review published by our group provided an overview of vascular ultrasound-based shear wave elastography methods in (mimicked) human and non-human arteries affected by different stages of atherosclerotic diseases or diseases related to atherosclerosis. This review also summarizes results obtained in arteries using group- and phase-velocity-based/guided-wave-analysis-based methods until 2020 (Pruijssen, 2020). One of the aspects our group pioneered in was in visualizing that shear waves propagate along the circumference in vessel-mimicking phantoms when a push is applied in the vessel wall in a cross-sectional transverse plane. We have developed, and are further improving ultrasound shear wave imaging sequences and software to derive shear wave velocity and elasticity maps for these transverse vessel cross-sections. This technology is expected to allow for visualization and detection of soft lipid-rich cores in atherosclerotic plaques. Rupture of such plaques in the carotid arteries is one of the main causes of stroke. This application is investigated in the Ultra-COMPASS RIHS junior researcher project. Figure 7 shows shear wave propagation maps for a vessel-mimicking phantom with a stiff wall and a soft inner layer, which mimicks an atherosclerotic vessel wall with an eccentric soft plaque. As can be observed, the wave propagates slower in the soft inner layer than in the stiff vessel wall. This is a first indication that the detection of soft plaque is possible using shear wave elastography technology adapted for application in transverse vessel planes. Shear wave elasticity imaging in vessels in a longitudinal plane is also possible, however not every plaque can be visualized in this imaging plane.
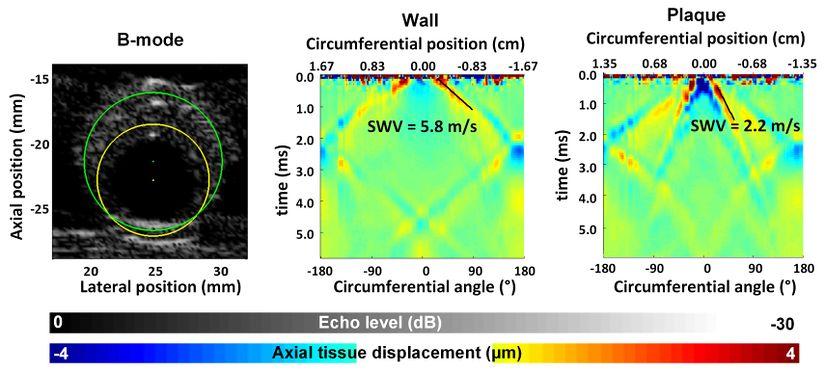
Figure 7: Left: B-mode images of a vessel-mimicking phantom consisting of a soft eccentric layer inside a stiff concentric layer. The green and yellow circle indicate the circumferential paths along which the axial tissue displacement maps of wall and plaque were derived which are shown in the center and right image, respectively. The displacement maps show the axial motion mapped as a function of circumferential position and time. Derived shear wave velocities are indicated. These images were adapted from H.H.G. Hansen et al., Proceedings of the 2015 IEEE International Ultrasonics Symposium, Taipei, Taiwan, 2015.
Triggered SWE acquisition
Current commercial SWE does not allow triggered acquisition and often uses large temporal filters for smoothing of shear wave elastography maps. This implies that it is usually not possible to capture temporary changes in elasticity of tissues and link them to specific physiological or pathophysiological events. The main applications for which we are developing dedicated triggered shear wave elastography sequences is to study changes in arterial stiffness during the cardiac pressure cycle.
Standardization and performance quantification and monitoring of SWE equipment
Transient elastography using a Fibroscan device is currently the most widespread method to assess liver stiffness. The Fibroscan induces shear waves in the tissue using a vibrating piston placed against the skin and then measures the propagation of these shear waves in the liver using fast 1D ultrasound acquisitions. The technology is highly optimized to give a quantitative point measurement of the liver stiffness. However, it does not allow to visualize the measured region and to construct an elasticity map. 2D ultrasound-based shear wave elastography might be of added value, because it 1) provides an ultrasound image of the tissue at the position of elasticity measurement, and 2) makes it possible to study elasticity variations throughout the liver. Hence, we are involved in multiple studies that compare the performance of 2D SWE equipment versus the Fibroscan. Futhermore, we are participating in the Quantitative Imaging Biomarker Alliance – Ultrasound Shear Wave Speed (SWS) committee (QIBA-US-SWS) of the FDA (Food and Drug Administration, USA) and used to be involved in a workgroup of the IEC (International Electrotechnical Commission) which aim to improve the quality of SWE equipment and measurements. Currently the standardization efforts focus on the liver, as it seems to be the application that can be standardized most easily. However, this will be extended to other tissues in the future. The QIBA-US-SWS committee is continuously working on improved versions of a profile for standardized shear wave elasticity assessment in liver for the detection of liver fibrosis. As a sideproject of the IEC workgroup a phantom material was developed which mimicks the viscoelastic, ultrasonic and magnetic resonance properties of healthy liver tissue. This sideproject was initiated and led by researchers from the Department of Radiology of Charité in Berlin, Germany. More info on the material was published in Investigative Radiology (Morr, 2021).