Research
CAUS
Liver fat content quantification
Liver lipidosis, also called hepatic steatosis, is a growing problem in modern society. In order to get an accurate measure of the liver fat content, a biopsy, MR-spetroscopy of MRI-PDFF is indicated. However all these techniques are rather invase, time consuming and expensive. Therefore there is a high need for a non-invasive alternative. Ultrasonic Tissue characterization (UTC) is a powerful non-invasive method for describing ultrasound tissue parameters. Using an animal model for human liver lipidosis, we showed in a pilot study (Thijssen et al. 2008) and in extended studies (Starke 2010) (Weijers 2010) (Weijers 2012) that quantitative UTC parameters obtained from calibrated B-mode images can be used for staging of lipidosis. Calibration of and correction for the machine dependent characterics are required in order to detect patient specific characterics which links to the pathological state of the tissue imaged. In 2016 the first in-vivo pilot results were published, followed by an extensive validation study on 195 patients parallelled by a liver biopsy published in Radiology
NEWS
2022 October 19 | Auntminnie article on the Radiology paper
2022 October 18 | In vivo CAUS validation study published in Radiology
January 2017 | we were involved in a special of the ' NTR - De Kennis van Nu' program called: "A dry month". We performed CAUS and Shear-wave imaging examinations for estimation of liverfat and stiffness. NTR - De Kennis van Nu - A dry month
December 2 2016 | CAUS in Auntminnie news: Quantitative ultrasound method stages fatty liver AuntMinnie newsitem
Background
Over the past years the MUSIC group developed the Calibrated UltraSound (CAUS) protocol and software for semi-automatic and quantitative (objective) analysis of UltraSound (US) B-Mode images. The primary goal of this project is to quantify the fat content in the liver using quantitative ultrasound B-mode parameters. Additional research to the feasibility of measureing fibrosis is performed.
Methods
To validate the CAUS techinique an extensive study on early lactating dairy cows was performed, who were indicated for a abomasal displacement correction surgery. We showed in a pilot study (Thijssen et al. 2008) and in a second, more extensive, study (Starke et al. 2010) that UTC parameters obtained from quantitative B-mode images can be used for staging of lipidosis. Several post-processing steps like: Look-Up-Table correction, Back-Scan conversion (figure 1), attenuation correction, and Automatic Gain Correction (AGC) were applied. Also an automatic segmentation, i.e., removing the non-liver tissue like bile ducts and the hepatic vessels from the region-of-interest (ROI) was performed (Figure 2c) (Weijers et al. 2012). From the resulting segmented ROI the following histogram (Figure 2b,d) and texture parameters (Figure 3) are estimated on average and as a function of depth:
CAUS parameters
- mean echo level (MU [dB] expressed relative to reference phantom)
- Depth depence of MU (slope of linear fit) i.e. the Residual attenuation coefficiënt (RAC [dB/cm/MHz])
- Standard deviation of MU (SD [dB], average and slope of linear fit)
- Signal to noise ratio (SNR=MU/SD, average and slope of linear fit)
- Axial speckle size at the -3dB level (AX [mm], average and slope of linear fit)
- Lateral speckle size at the -3dB level (LAT [mm], average and slope of linear fit)
- Axial amplitude (AX [dB], average and slope of linear fit)
- Lateral amplitude (LAT [dB], average and slope of linear fit)
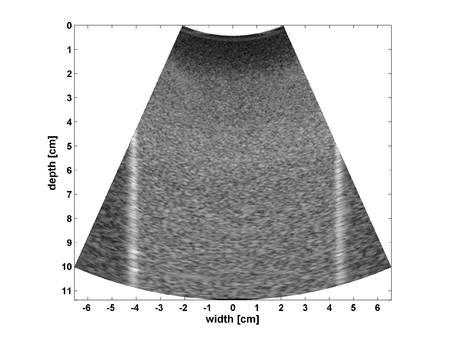
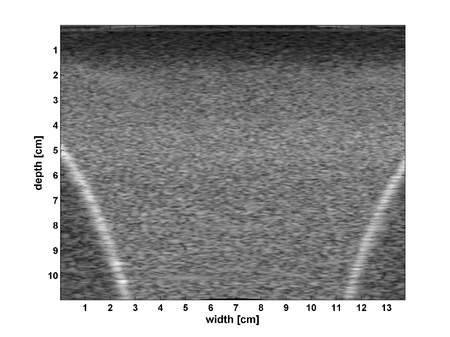
Figure 1. Homogeneous imaged part of a tissue mimicking phantom. a) Normal (scanconverted) B-Mode image b) and Back-scanconverted B-Mode image
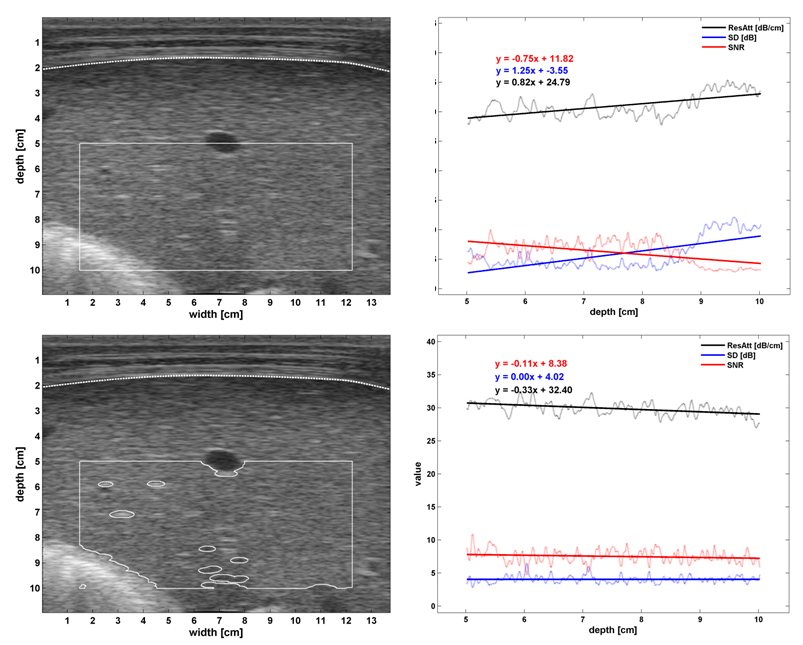
Figure 2. (a) Initial ROI (b) UTC parameter vs depth curves before segmentation (c) ROI after automatic segmenation (d) UTCP vs depth curves after segmentation
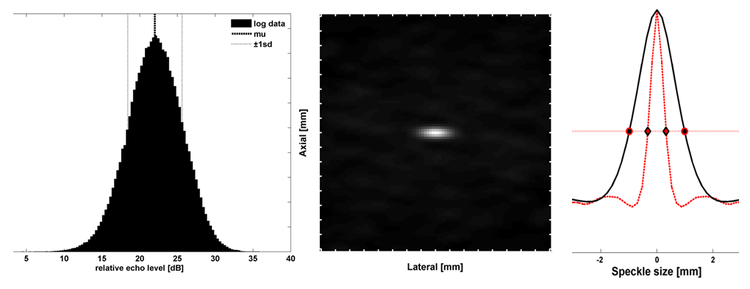
Figure 3. Total ROI parameters plots (a) Histogram for MU, SD & SNR (b) 2D autocovariance function of texture (c) Axial and Lateral speckle size curves with FWHM estimates
Results in cows
High correlations of several UTCP's with histology were found. The Residual Attenuation Coefficient (RAC) parameter showed highest correlations (up to R=0.84) in all bovine studies. ROC analysis showed high values for Area Under Receiver Operating Curve (AUROC) 0.83-0.94 if differentiation between several risk-groups. Implementation of an fully automatic segmentation procedure resulted in equal high values for AUROC: 0.94 (Weijers, UMB, 2010) Also is proven that transcutaneous image acquisition and analysis provide equal performance as intraoperative image acquisition and analysis an thus the attenuation correction made for the superficial tissue layers in transcutaneous images is warrent, and that a Tissue Mimicking Phantom instead of a 'normal group' can be used for the Beam-profile correction (Weijers, UMB, 2012).
in-vivo Results
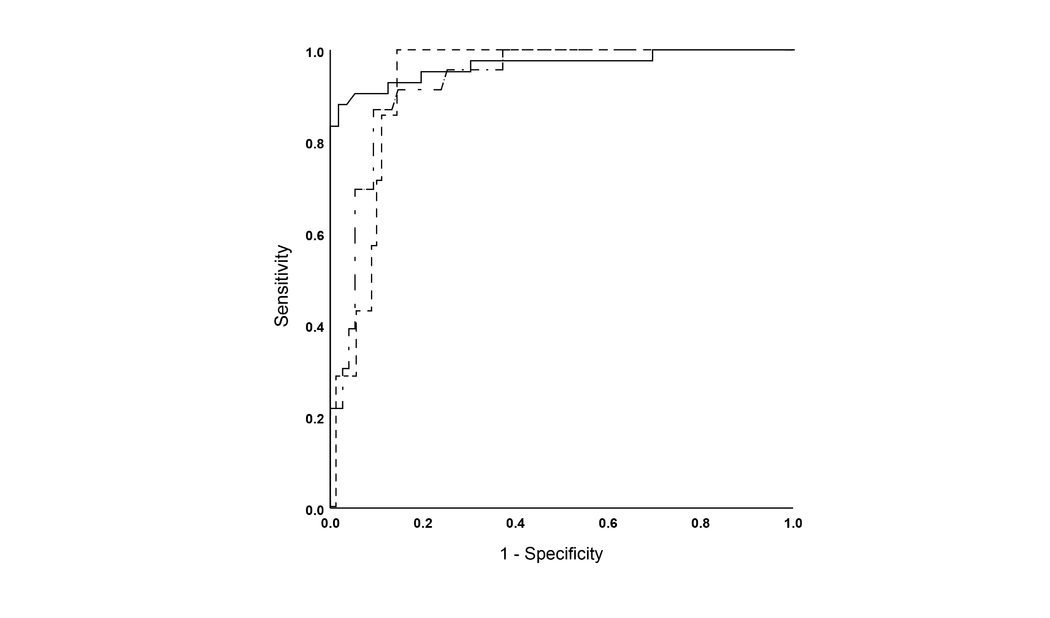
In a recently published manuscript (Weijers, Radiology, 2022), a total of 195 patients (mean age, 50 years 6 13 [SD]; 110 men) were included and divided into a training set (n = 97 [50%]) and a test set (n = 98 [50%]). Te average CAUS interobserver correlation coefficient was 0.95 (R range, 0.87–0.99). Te best correlation with steatosis was again was found for the RAC parameter (R = 0.78, P <0.01). Steatosis detection using RAC showed an AUROC of 0.97 (95% CI: 0.94, 1.00), and the multivariable AUC was found to be 0.97 (95% CI: 0.95, 1.00). The predictive performance for moderate and severe hepatic steatosis using RAC was 0.93 (95% CI: 0.88, 0.98) and 0.93 (95% CI: 0.87, 0.98), respectively (Figure 4).
Conclusion: The generic CAUS parameter RAC detects and stages steatosis accurately with limited interob-server variability, and performance is not hampered by the presence of fibrosis.